
Fourth Quarter 2017
- The observed annual inflation rate for house prices amounts to 3.7 % in the fourth quarter of 2017 and remains unchanged compared to the previous quarter.[1]
- The average inflation rate for the last four quarters also amounts to 3.7 %.
- The house price index goes down by 0.4 % in the fourth quarter of 2017 compared to the previous quarter.
Each quarter, Statbel, the Belgian statistical office, calculates a house price index according to European regulations (see documentation for detailed information on the methodology).
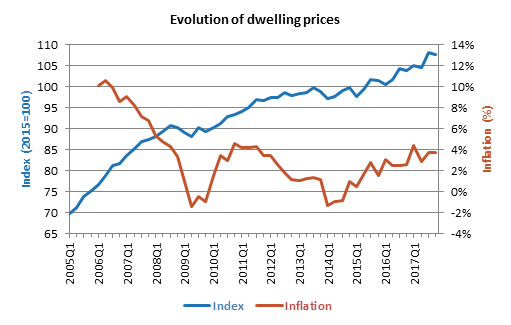
The annual inflation rate for house prices amounts to 3.7 % in the fourth quarter of 2017, just like in the previous quarter. The average inflation rate for the last four quarters also amounts to 3.7 %. The house price index amounted to 107.78 points (2015=100) compared to 108.18 points in the previous quarter. The Belgian house price index goes down by 0.4 % in the fourth quarter of 2017 compared to the previous quarter.
The European Union Member States calculate the house price index according to a harmonised methodology which makes it possible to compare the evolution of house prices across the different Member States. The house price index measures the price evolution of private real estate. The index follows price changes of new or existing residential real estate purchased by households, irrespective of their purpose (letting or owner-occupying). The house price index measures the price evolution with the assumption that the characteristics of the property sold remain unchanged.
The index thus measures the actual price evolution without interference of qualitative changes. If the size of the property sold increases, the average price of houses sold will also increase, which does not necessarily mean that the house price index will have increased. Therefore, this index does not measure the evolution of the average sales price of real estate. More information on the applied method can be found on page 5 of this press release.
The house price index is based on real estate transaction data from the General Administration of the Patrimonial Documentation of the FPS Finances. The results for the latest quarters are considered provisional and may be reviewed during the following quarter when additional data become available.
The house price index can be broken down by two items (new houses and existing houses). In the fourth quarter of 2017, annual inflation amounted to 4.9 % for new houses and 3.3 % for existing houses. The weights of those two items in the overall index amount to 24.2 % and 75.8 % respectively for the year 2017.

Comparison between Belgium and the neighbouring countries
Since Eurostat will only publish the neighbouring countries' house price index for the fourth quarter of 2017 on 11th April 2018, the third quarter 2017 is the most recent quarter to use as a basis for comparison. In Belgium, inflation stood at 3.7 % in the third quarter of 2017 compared to 2.9 % in the previous quarter. The Netherlands experienced an inflation rate of 10.2 % in the third quarter, an increase compared to the 7.4 % inflation rate in the second quarter. France experienced an inflation rate of 3.9 % in the third quarter, an increase compared to the 3.2 % inflation rate registered in the second quarter. In Germany, inflation amounted to 3.6 % in the third quarter of 2017 compared to 3.8 % in the second quarter. Inflation for the euro area as a whole went from 3.7 % in the second quarter 2017 to 4.1 % in the third quarter.

[1]Figures for the current year are considered provisional and may be reviewed in later publications.